
Encountering the 95% confidence interval is inevitable in the realm of statistics, a concept that often leaves individuals perplexed. Despite its frequent appearance, the meaning behind this statistical measure remains elusive to many.
In this article, we will explain what is the 95% confidence interval, calculation formula, and establishing its correlation with identifying significant differences.
What is a confidence interval?
One of the purposes of inferential statistics is to infer characteristics of a population. A typical example of a population characteristic is the population mean (i.e., the average value of a variable in the population).
However, to obtain this population mean accurately, it is necessary to collect all the data in the population.
If the population is some finite number, it may be possible…. But in most cases, even if the population is infinite or finite, it is too expensive and time consuming to collect data to go around and make it practical! ….

Instead, we usually take a random sampling from the population and use that sample data to infer population characteristics (i.e., the “population mean”).
For example, suppose you want to estimate the average grip strength and average walking speed of the elderly in your surrounding area.
In this case, instead of collecting physical fitness data from all the elderly in the local area, you could randomly sample the local elderly and use the data from this sample to estimate the population mean.

At this point, the question is,
‘Maybe we’ll accidentally select a sample that is biased toward lower physical fitness or vice versa?’
Calculating the average and standard deviation are not enough. Because the average acts as a single guess, or “point” estimate.
Why do we call it a “point” estimate?
When you gather fitness data, like Sample 1, Sample 2, and Sample 3, you’ll notice that each sample has a different average compared to the overall population average.
Simply put, the average of a sample doesn’t always match the average of the whole population.
This fact is really important!
The average is trying to make a single guess to represent the entire population.
To solve this concern (uncertainty), a calculated range that would include the population with a reliable probability is called a
” confidence interval”.
Confidence interval
Confidence interval is a tool that gauges the range around the sample mean, providing an estimate of the likely interval within which the population mean of the data falls.
Confidence interval formula
Now, to make sense of the confidence interval (CI), you should know about something called Standard Error (SE).
Standard Error is a bit like the standard deviation, but here’s the difference:
Standard Error focuses on how much our sample mean might vary from the true population mean.
We can calculate Standard Error using a formula:
Standard error(SE) = Standard deviation(SD)/sqrt(n).
To caluculate confidence interval, use following fomula:
Sample Mean ± (Critical value) × (Standard error)
By this formula, a confidence interval is a range that contains a population parameter (e.g., the population mean) with some probability within an interval with an upper and lower bound.
Confidence intervals are generally expressed as
[lower limit, upper limit]
Interpretation of confidence intervals
For example, when you speak of a 95% confidence interval, don’t you interpret it as “95% probability that the population parameter falls within the interval”?

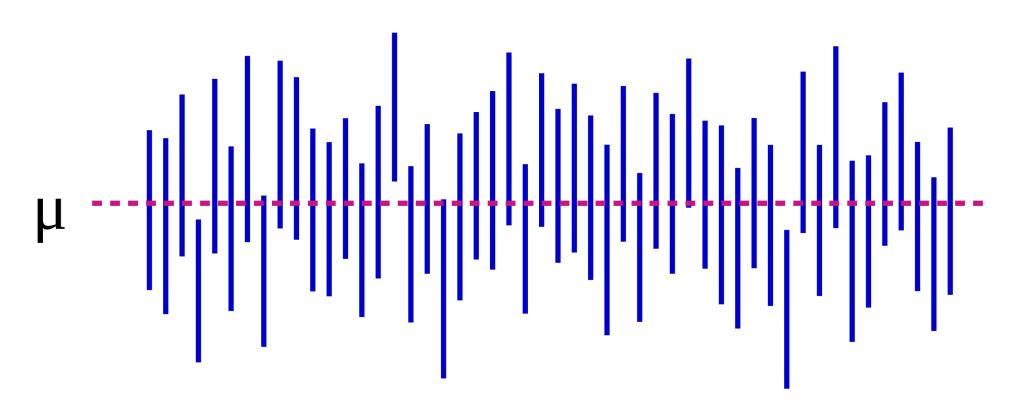
In fact, since a confidence interval represents an interval that “contains” a true population parameter that exists somewhere 95% of the time, “If we repeatedly extract a sample from the population to obtain a confidence interval, then 95 times out of 100 the confidence interval contains the population parameter.” is the correct interpretation.
Note that it is a “percentage”, not a 95% probability.
The probability of a true value existing in the confidence interval is “included = 100%” or “not included = 0%”.
In fact, the data collection was done only once, so there is still a sense that it does not add up when people say “95 times out of 100 times it contains true values” 😓.
The figure below is an example of a confidence interval with 50 iterations, please refer to it.
Confidence interval for population mean
The formula for a confidence interval for the population mean is as follows:
confidence interval = sample mean ± z ×(s/\(\sqrt{n}\))
WHEREAS
- z: z value
- s: Standard deviation of the sample
- n: Specimen size
The Z value used also depends on the confidence level selected.
A common confidence level used is 95%, so Z=1.96.
For example, the grip strength of an elderly woman living in your neighborhood
- Mean: 23.25 kg
- Standard deviation:11.81㎏
- Sample size:30人
- z:95%
Then, the 95% confidence interval is
23.25±1.96×(11.81/\(\sqrt{30}\))=23.25±4.23
[19.02, 27.48]
About confidence intervals
Here is lists that affect the size of the confidence interval.
1. specimen size:
The larger the sample size, the narrower the confidence interval.
2. confidence level:
The larger the confidence level, the wider the confidence interval. For example, a 99% confidence level would be as large as Z=2.58.
summary

This is a brief summary of confidence intervals. It is important to understand the basic theory, as there are many situations in which confidence intervals must be carefully considered in research and other statistical analysis.
